Dashboard
The Dashboard is the first thing you will see when you log in to your Bridgebills. It provides an overview of your financial health of your business and helps you track the following aspects:
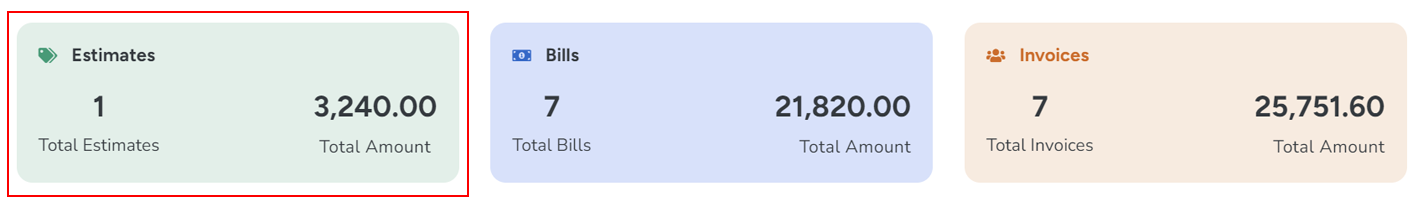
Estimates
Estimate section displays the Number of estimates and total amount of estimates for the selected month.
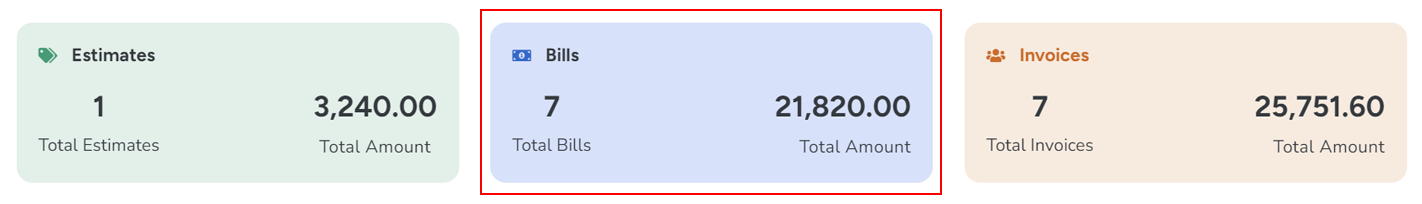
Bills
Bills section displays the total number of bills generated and total cost for the selected month.
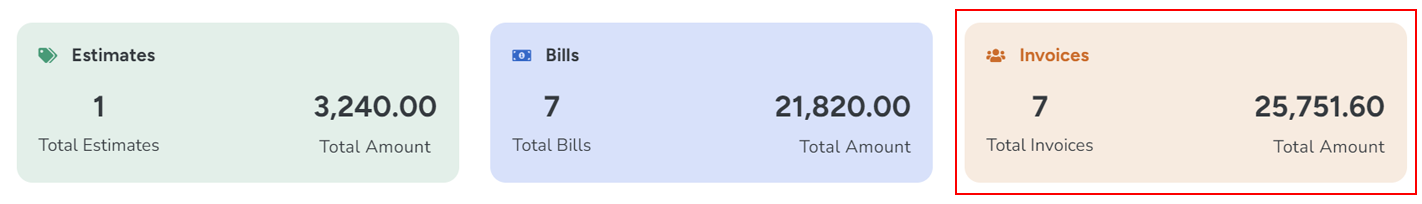
Invoices
Invoice section displays the total number of Invoice generated and total sales for the selected month.
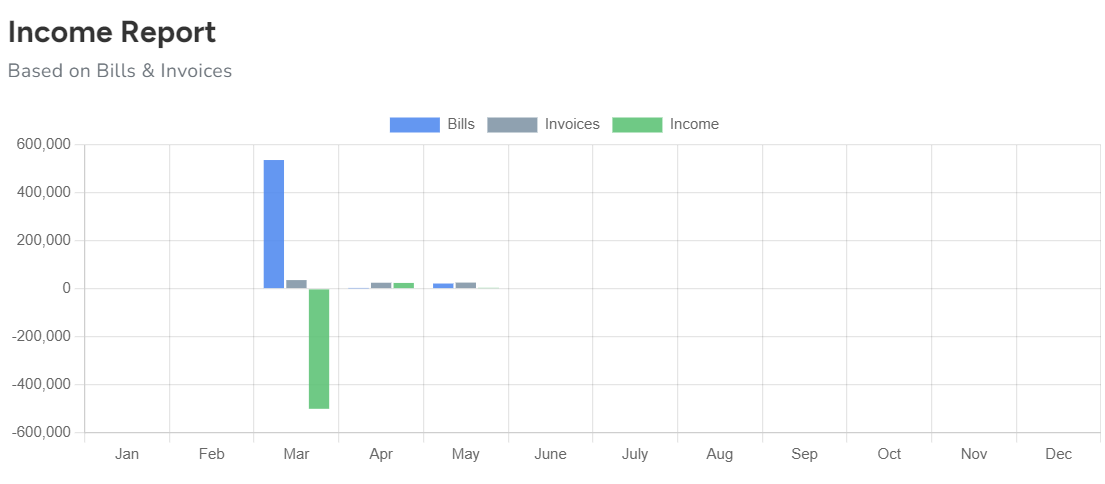
Income report
Income report graph displays the total income of the organization based on the bills and invoices created in bridgebills.
It offers a graphical representation of the income for a particular month, providing a visual overview of earnings.
Bar Graph displays the Cost,Sales and Income of every month.
Things You Can Do
Bridgebills provide a quick way to navigate to different submodules, which helps to manage the required operations in a rapid manner.
Recent activities
In this section BridgeBills provide an option to view the action done by the user on each module on the respective dates.
BridgeBills offers the ability to identify whether the action is carried out from a computer or a mobile device.
Project
Project section displays the Estimate amount, bill amount and Invoice amount with respect to a project.